
Issue Profile
The Setup: Records Without Reward
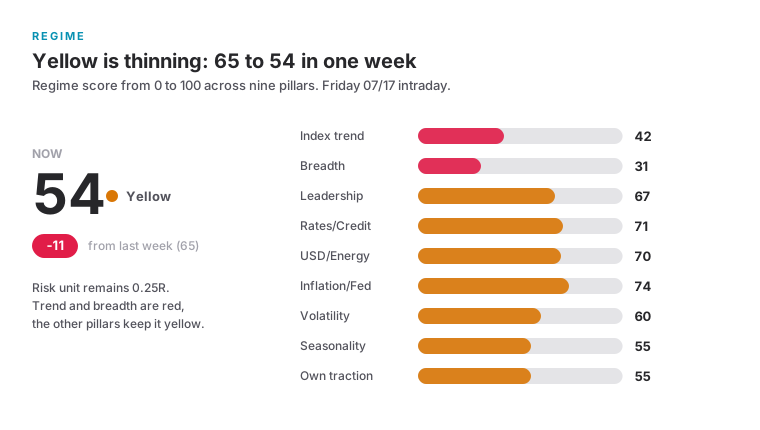
This week the market answered an uncomfortable question: what happens when companies report records and their stocks still fall? TSMC increased quarterly profit by 77%. JPMorgan posted the highest quarterly profit yet reported by a US bank. Netflix reached record revenue. Yet chips and artificial-intelligence stocks came under pressure, Netflix fell on its outlook, and the WickedDesk regime score dropped from 65 to 54.
The market is not rejecting demand altogether. It is testing the cost of building for it. TSMC raised its capital spending range to 60 to 64 billion dollars. At the same time, Chinese DRAM maker CXMT doubled the planned size of its IPO to 8.6 billion dollars. Higher spending and visible new supply hit an already crowded trade.
Leadership still exists, but it is narrow. Cybersecurity ranks first among themes, healthcare and pharma lead the sectors, and selected refiners hold near their highs. Only 32.7% of the universe is advancing. The risk unit therefore stays at 0.25R, strong charts are studied, vertical moves are not chased. And in a market sorting this selectively, cash is not a missed opportunity but a position of its own.
Market Picture: Five Days, One Tipping Point
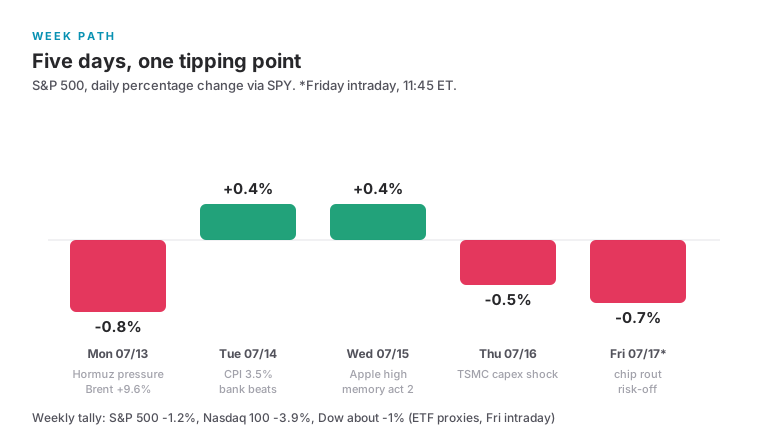
The week was not a smooth decline. Monday brought pressure from Hormuz, oil and the first selloff in the memory complex. Tuesday delivered a counter-move after cooler CPI and strong bank results. Wednesday extended the bounce, but capital was already rotating away from semiconductors into other groups.
Thursday changed the reading of earnings season. TSMC delivered revenue and margins at the high end, but higher capital spending moved the cost of the artificial-intelligence buildout to center stage. On Friday the chip selloff continued, amplified by Moonshot's release of the open frontier model Kimi K3, Netflix weighed after a weaker outlook, and the United States expanded attacks on Iranian bridges and energy sites.
The ETF proxies show a weak weekly tally around 11:45 ET on Friday. SPY is down roughly 1.2% and QQQ roughly 3.9%. These are intraday readings, not closing prices. The regime score tells the change more simply: 65 one week ago, 54 today.
What Changed the Weekly Plan
Five events changed the plan. CPI eased inflation pressure without promising a quick Fed pivot. TSMC's record quarter shifted attention from demand to investment costs. CXMT turned the memory concern into a visible supply event. Moonshot's Kimi K3 asked who earns from the AI buildout once frontier models become open. And the renewed escalation around Hormuz kept both oil and geopolitical gap risk in play.
What Changed The Weekly Plan
June CPI
Bank earnings
TSMC Q2
Netflix Q2
CXMT financing
Moonshot releases Kimi K3
Hormuz and Iran
Breadth: The Warning from Issue 004 Is Here
In issue 004, weak breadth was still a brake beneath stable indices. It is now a risk factor in its own right. On Friday, 32.7% of stocks are advancing. There are 157 names up more than 4% and 381 down more than 4%. The breadth pillar reads 31 out of 100 and is red together with the index-trend pillar.
The picture is not fully broken. Some 51.7% of the universe remains above its 50-day line and leadership scores 67 out of 100. That is not broad capitulation. It is a leadership change under heavier selling pressure.
For new trades, the index no longer carries a breakout automatically. A candidate needs its own relative strength, a confirmed group and a tight structure. If one of those three is missing, it stays on the watchlist.
QQQ: The Checkpoint Has Triggered
Issue 004 defined a daily close below the 50-day line in QQQ as the first measurable deterioration. On Friday, QQQ trades roughly 3.1% below that line and about 6.9% below its 52-week high. The short-term trend is broken.
The long-term trend is not. QQQ remains above its 200-day and 50-week lines. This still fits a correction inside the larger uptrend, not automatically a new bear market in the broad index.
The working rule is clear: no added index exposure until QQQ reclaims its 50-day line. Individual stocks may outperform the index, but they have to prove that strength in both the chart and the group.
Rotation: Security Leads, Semiconductors Fade
Cybersecurity rises from theme rank 2 to 1. The group is up 0.6% on Friday, carries 19% one-month momentum and is led by PANW, CRWD and OKTA. Rank and momentum point in the same direction.
Semiconductors remain formally ranked 2 but lose 2.0% on the day and 15.3% over one month. The rank still measures the preceding strength. The current move measures distribution. Reading only the rank means buying the past.
Genomics holds rank 3 with 17.1% one-month momentum, transports jump from 12 to 4, and cloud computing from 14 to 7. Rotation is broadening a little, but it remains selective.
Group Strength: Read Rank and Power Separately
The ranking is a compass, not an entry. The key question is whether daily action, one-month momentum and Atlas structure tell the same story. Cybersecurity passes that test. Semiconductors do not. Genomics passes only in selected charts.
| Rank | Group | Today | Status | One_month |
|---|---|---|---|---|
| 1 | Cybersecurity | +0.6% | Leading | +19.0% |
| 2 | Semiconductors | -2.0% | Decision zone | -15.3% |
| 3 | Genomics | -1.6% | Selective | +17.1% |
| 4 | Transports | -0.4% | Improving | +2.5% |
| 7 | Cloud Computing | -0.7% | Improving | +13.6% |
Cybersecurity
Up from rank 2 to 1. Daily action and one-month momentum point in the same direction.
Semiconductors
Still ranked 2, but both daily and monthly momentum are negative. This is a decision zone, not an entry.
Genomics
The intermediate trend holds, but Friday demands bases instead of chasing.
Transports
Up from rank 12 to 4. Leadership is broadening slightly beyond artificial-intelligence hardware.
Energy
The sector is not broadly strong, but selected refiners remain firm as oil and Hormuz dominate the tape.
Cloud Computing
Up from rank 14 to 7. Security remains the strongest subgroup.
Semiconductors: The Invoice for the Buildout
TSMC reported revenue of 40.2 billion dollars and a gross margin of 67.7%. Third-quarter guidance stands at 44.6 to 45.8 billion dollars. At the same time, planned capital spending rises to 60 to 64 billion dollars. The market did not reward the records because it is repricing the cost of the next growth step.
The counter-case remains real. Demand and margins are high and advanced manufacturing capacity remains tight. The chart nevertheless says those arguments were already known. New buyers first have to show that they can absorb the selling pressure.
For the playbook, semiconductors are neither a short thesis nor cleared for new longs. A multi-day stabilization, lighter selling volume and a QQQ reclaim would be the first evidence that the group is actionable again.
Memory: A Bear Market Below the Index Surface
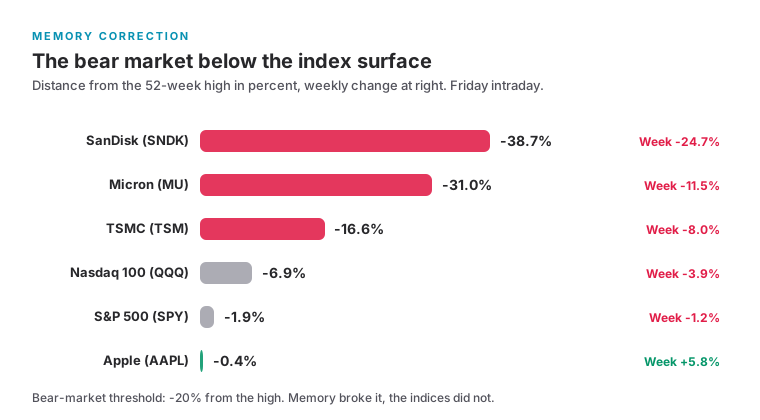
WickedDesk's own charts show the depth of the correction more clearly than the index. SanDisk sits roughly 39% below its 52-week high, Micron about 31% and TSMC about 17%. QQQ and SPY have fallen much less. A hard repricing is already taking place below the index surface.
CXMT adds to the debate. The company doubled the planned size of its IPO to 8.6 billion dollars while Apple is examining China sourcing. That is not proof of immediate oversupply in advanced memory for artificial-intelligence systems. It is, however, a visible capital and supply impulse for 2027.
RS readings can stay high for a long time during such transitions. The actual chart now matters more. MU and SNDK remain study names until they build a first durable base.
Kimi K3: China's Second DeepSeek Moment
On Thursday, Moonshot AI released Kimi K3, the largest open AI model to date: a mixture-of-experts architecture with roughly 2.8 trillion parameters and a one-million-token context window, launched in two variants for chat, agent and parallel swarm workloads. On the published benchmarks the model closes in on the US frontier and, depending on the measurement, trails only the two leading American systems. The weights are announced to be openly available by July 27.
The market read the release as the event everyone has expected since the DeepSeek shock of 2025 and nobody was positioned for anyway. Taiwan closed more than 6% lower on Friday, Japan 4%, Nvidia and Alphabet each gave up around 2%, and the listed Chinese model rivals were sold outright, with Z.ai down about 27% and MiniMax around 16%. Together with the TSMC spending debate this forms the double burden that shaped Friday.
Both stories ask the same question from two sides. TSMC shows what the AI buildout costs. Kimi K3 asks who earns from it once frontier models become openly and cheaply available. The honest counter-thesis belongs next to it: after the 2025 DeepSeek moment, demand for inference compute kept rising, because cheaper models make more applications economical. In the short term, however, the repricing hits model vendors and the compute trade at the same time, and July 27 now bundles two test dates into one day: the CXMT IPO and the open K3 weights.
Healthcare: Broad Substance Instead of a Single Hype Move
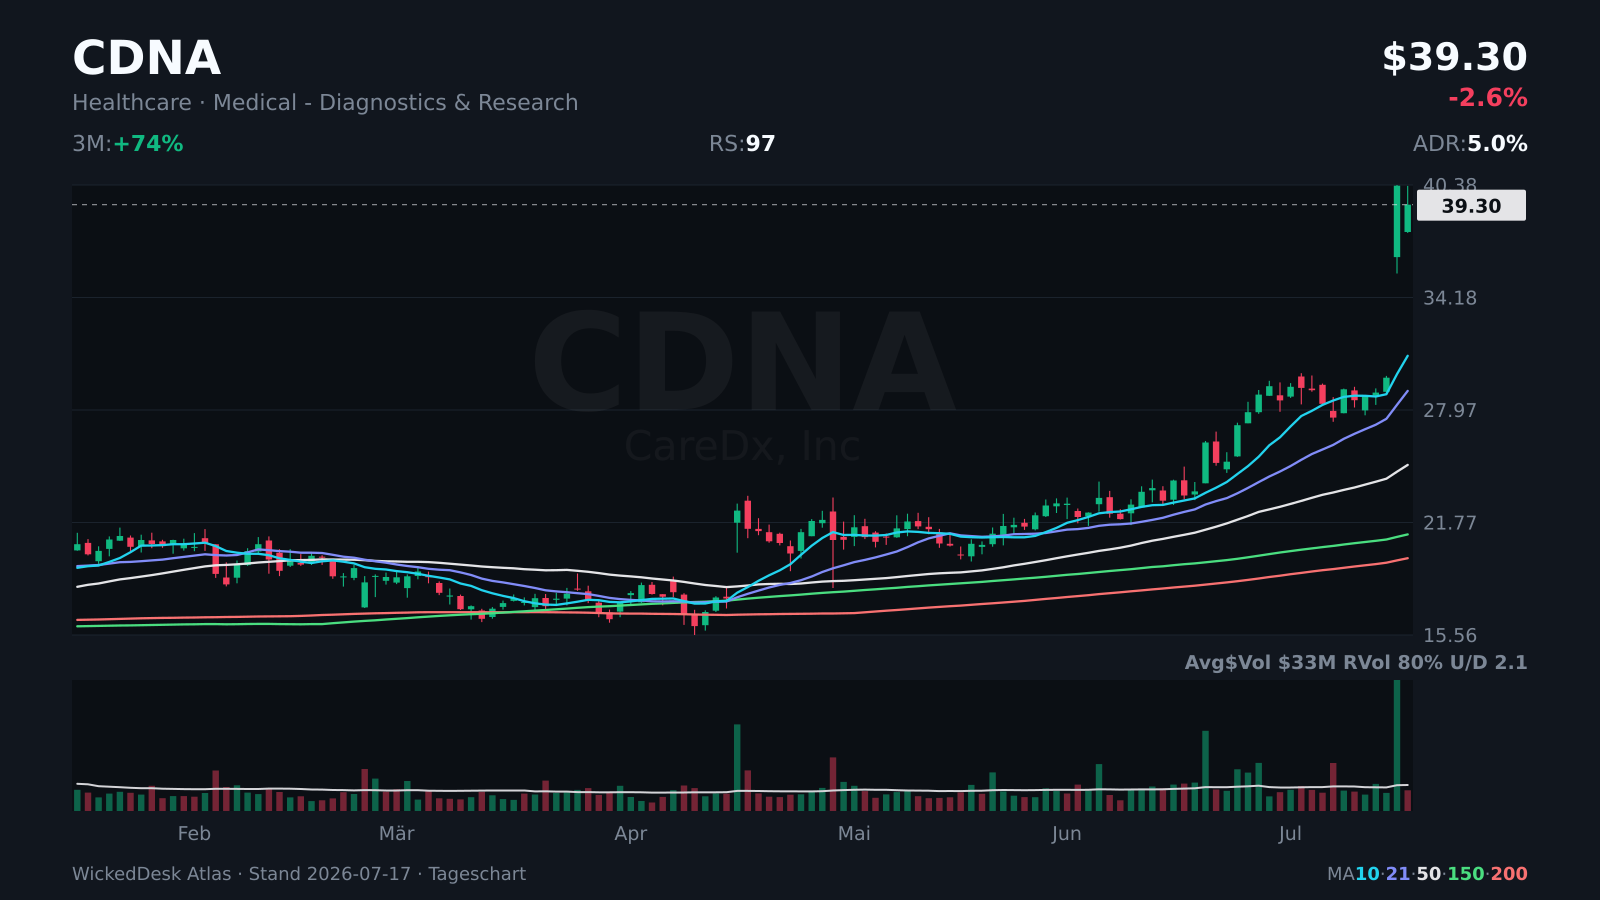
Healthcare and pharma lead the sector ranking with 9.5% one-month momentum. Genomics ranks third among themes. The grid shows several liquid names with high relative strength, including CDNA, FATE and EDIT.
The quality lies not in one green day but in the multi-week distribution of strength. That separates healthcare from a pure headline trade. Even here, vertical gaps are not entries. CDNA becomes interesting when its latest thrust turns into a tight post-EP base.
CRNX marks the boundary. RS 98 and 149% one-month momentum are exceptional, but the Atlas chart is too steep after the gap. A strong name can still be a poor entry.
Energy: A Hedge with Event Risk
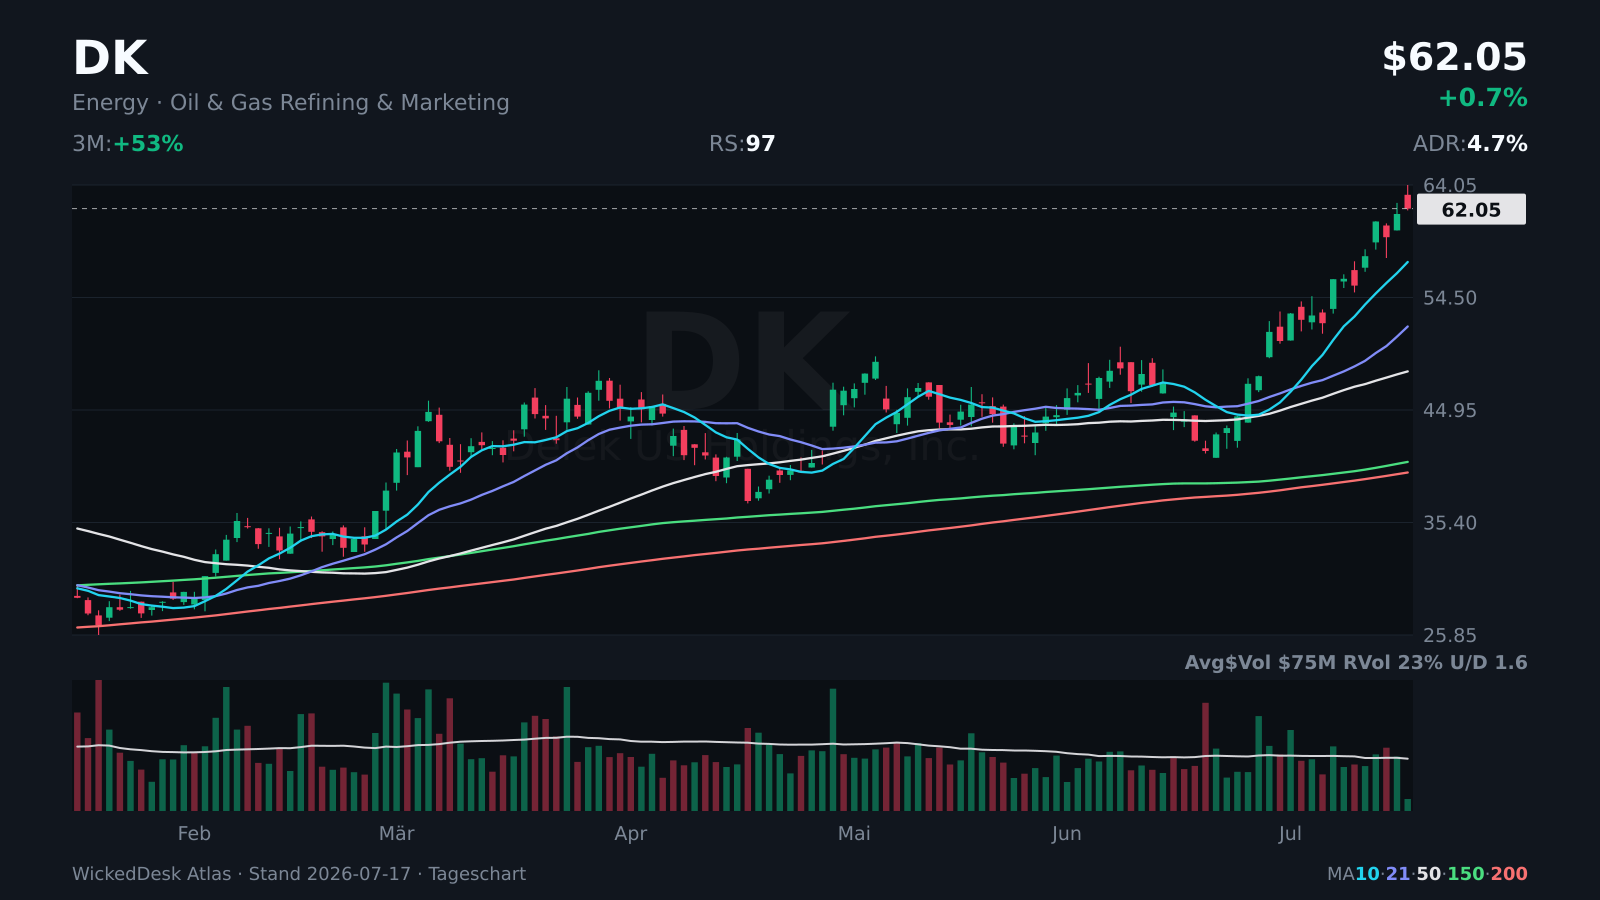
Energy is not broadly strong over one month. Selected refiners nevertheless form a clear block. DK, PBF and DINO carry high RS readings and trade near their highs. Oil above 86 dollars supports that relative strength.
On Friday, the United States expanded attacks on Iranian bridges and energy sites. Traffic through Hormuz also fell to a three-week low. That makes energy a hedge against further escalation, but not a risk-free momentum trade.
A diplomatic opening could move the same chart lower overnight. Trade smaller than normal, do not chase vertical breakouts, and use the latest base as a hard invalidation.
Cybersecurity: Improvement Becomes Leadership
Issue 004 marked cybersecurity as the strongest riser. One week later the group ranks first. This is a clean follow-up: rank, one-month momentum and the leading charts confirm one another.
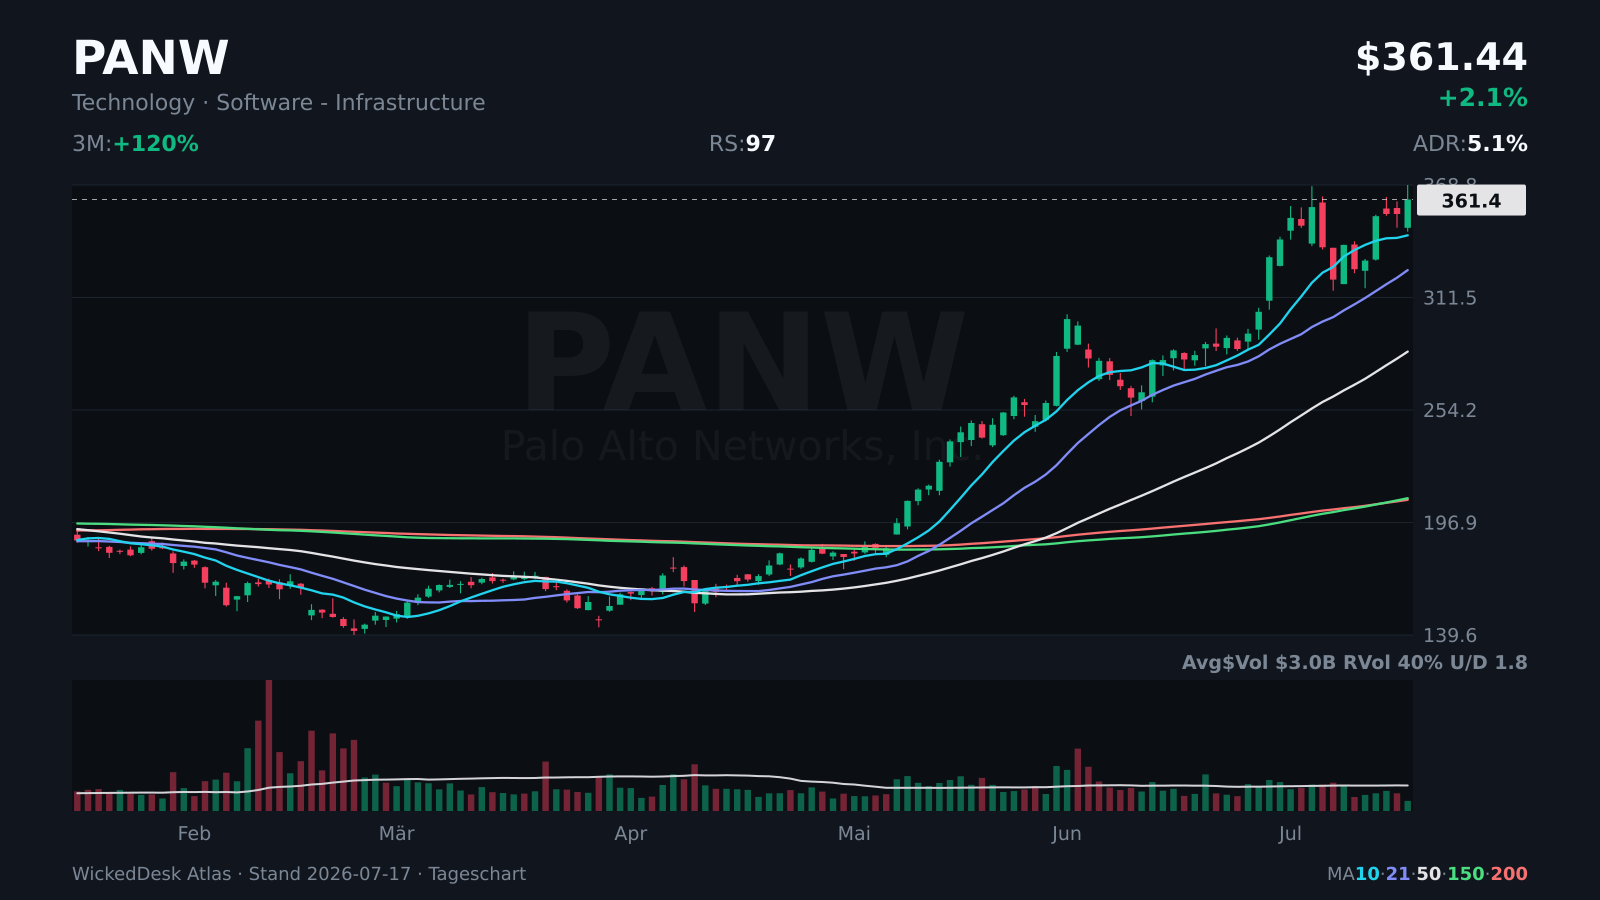
PANW is the most liquid expression. RS 97, roughly 3.4% distance from the high and 120% three-month momentum combine relative strength with institutional liquidity. CRWD and OKTA provide group confirmation.
The entry does not come from rank. It comes from the next tight range. Until PANW forms a controlled consolidation, the chart is a study. Above that range it becomes a setup. Below the 50-day line the study ends.
Earnings Season: Outlook Beats the Record
The week produced a clear reaction pattern. Banks benefited from trading, M&A and investment banking. TSMC delivered operating records but was judged on higher capital spending. Netflix reached record revenue but fell after a weaker third-quarter forecast.
The implication for holding through earnings is simple. The rearview number is not enough. Outlook, investment needs and the expectation already embedded in the price matter more.
| Lesson | Result | Company | Reaction |
|---|---|---|---|
| Strong bank results were partly expected | Highest quarterly profit yet reported by a US bank | JPMorgan | Limited despite the record |
| Capital-markets activity is the real driver | EPS $20.98, ROE 23.5% | Goldman Sachs | Strength from trading and transactions |
| Investment cost dominates the record | $40.2bn revenue, 67.7% margin | TSMC | Pressure after higher capex range |
| Outlook beats the completed quarter | Record revenue of $12.56bn | Netflix | Stock falls on Q3 forecast |
Atlas Selection: Three Charts, Three Conditions
The Atlas review does not produce a list to chase. It produces three different studies. PANW is the cleanest continuation from the leading group. CDNA shows healthcare strength but needs time after its gap. DK represents the refiner block and carries the largest event risk.
All three have RS 97. Their structures and invalidations are different. That is why the scanner is always followed by the Atlas chart.
Cybersecurity. Continuation from the rank-1 group. RS 97.
Cybersecurity leads the theme ranking. PANW combines RS 97, deep liquidity and an intact Stage 2 structure.
Genomics and diagnostics. Wait for a post-EP base. RS 97.
CDNA expresses the healthcare flow with RS 97 and strong one-month momentum. The recent gap needs a durable base first.
Oil & Gas Refining. Energy leader at the high. RS 97.
DK captures the relative strength of the refiners and trades near its 52-week high. Event risk requires smaller size.
Atlas Check: Palo Alto Networks (PANW)
PANW trades around 362.83 dollars, roughly 3.4% below its high. RS 97, ADR of 5.1% and about 3 billion dollars in average daily turnover make it the most liquid candidate in this issue.
The chart is intact but not automatically buyable. The study needs a tight multi-day range above the short moving averages. A break from that range, confirmed by CRWD and OKTA, would trigger another review. A close below the 50-day line ends the study.
Atlas Check: CareDx (CDNA)
CDNA combines RS 97 with 68% one-month momentum. The recent gap shows real capital flow but makes the entry harder. Immediately after such a move, the reward-to-risk profile is usually worse than the rank suggests.
The next useful information is not another high but the first base. If CDNA holds the gap and the daily range contracts, a post-EP setup can form. A break of the gap low or the 21-day line invalidates the study.
Atlas Check: Delek US Holdings (DK)
DK trades around 62.56 dollars near its 52-week high. RS 97, ADR of 4.7% and 40% one-month momentum confirm the strength of the refiner block.
The chart is extended and strongly tied to oil and Iran headlines. A controlled pullback to the 21-day line or a tight sideways phase would be healthier than an immediate breakout. The thesis ends below the latest base. Position size must account for a possible weekend gap.
SpaceX: Below the Offer Price
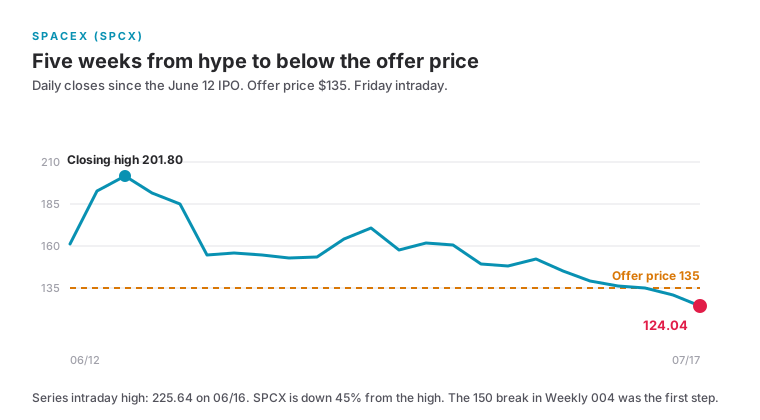
Issue 004 tracked the break of the 150-dollar area in SPCX. This week the stock fell below its 135-dollar IPO price for the first time. Early buyers are now underwater and every bounce can meet fresh supply.
The lock-up is also expiring, and more shares become available for trading in August. That adds supply pressure without settling the company's long-term value.
For the playbook, SPCX remains a case study. It becomes actionable only after a multi-week base and a durable reclaim of 135 dollars.
Checked and Rejected
Three names pass the first filter and fail on structure. CRNX shows RS 98, but the real Atlas chart is too steep after the vertical gap. AGL cannot be sized cleanly after an extreme three-month run and ADR of 9.4%. INTC carries a high RS reading from the past while the semiconductor group is clearly negative over one month.
The shared lesson is simple. A strong metric is not yet a setup. Rank, current momentum, chart structure and risk unit must fit at the same time.
RS 98 and a 149% one-month gain are strong, but the current chart is no longer a base after the vertical gap.
Strength is not automatically an entry.
A roughly 372% three-month run meets ADR of 9.4%. At 0.25R there is no clean position size left.
Extension does not replace structure.
The high RS reading looks backward while semiconductors are clearly negative over one month.
Rank and current momentum must agree.
Macro: Cooler Inflation, Hotter Oil
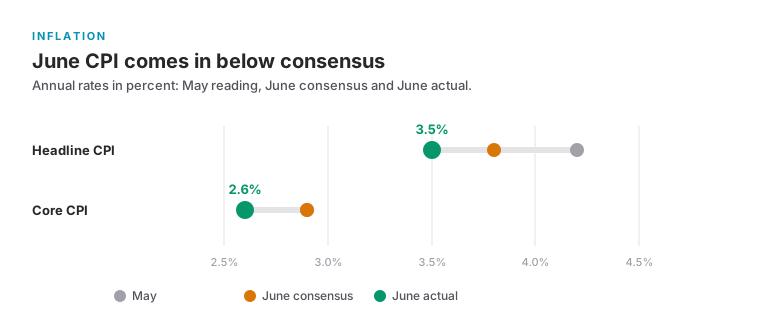
June CPI fell 0.4% month over month on a seasonally adjusted basis. The annual rate dropped from 4.2% to 3.5% and core inflation to 2.6%. That is genuine relief. Fed Chair Kevin Warsh nevertheless said one reading did not mean inflation had been defeated and did not indicate the next rate decision.
At the same time, oil trades above 86 dollars after the renewed Iran escalation. That can feed back into inflation later. The ten-year US Treasury yield stands near 4.6% in the WickedDesk snapshot and remains a headwind for long-duration assets.
The regime score captures the conflict. Inflation improves, while rates and energy remain restrictive. Yellow at 54 is therefore not a contradiction. It is the correct summary.
Working Rule: Ranking, Momentum, Chart
This week shows why WickedDesk needs three checks in sequence. Ranking identifies where longer-term relative strength sits. One-month momentum shows whether that strength is currently building or being distributed. Atlas decides whether the result creates an actionable entry.
Semiconductors provide the counter-example. Rank 2 looks strong, minus 15.3% over one month looks weak, and the charts show broken short-term trends. Cybersecurity provides the positive example. Rank 1, plus 19% over one month and intact leader charts all agree.
The sequence prevents two mistakes: buying old leadership and chasing new leadership.
Outlook: Five Measurable Checks
First, QQQ must reclaim its 50-day line. Without that reclaim, index exposure stays reduced. Second, the semiconductor complex needs a first base with lighter selling volume. Third, cybersecurity must confirm its rank leadership with tight charts. Fourth, Hormuz will decide whether energy remains a hedge or pulls back on a diplomatic opening. Fifth, July 27 bundles two test dates, the CXMT IPO in Shanghai and the announced open release of the Kimi K3 weights, and both measure how much supply and competitive pressure the AI trade can absorb.
The watchlist tasks are explicit. Check PANW for a tight range. Give CDNA time after the gap. Consider DK only after a pause or controlled pullback. Do not chase CRNX. And if none of these checks confirm, the right position is cash: in a market where two stocks fall for every one that rises, waiting is an active trade, not a failure.
This issue is based on data from Friday, July 17, 2026, around 11:45 ET. All Friday prices are intraday. The content is market observation, not investment advice.