
The Read: Rotation Against the Macro Wind
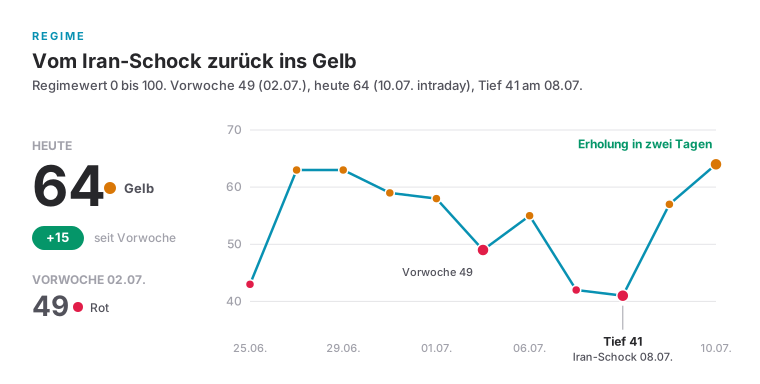
This week told three stories, and if you only heard one of them, you do not know this market. On Monday the Dow closed at a record 53,056 and the road looked clear. Two days later the Iran escalation had pushed Brent above 78 dollars and our regime score sat at 41, the lowest in weeks. On Thursday the semiconductors bought the market back as if nothing had happened. The week closed with a regime score of 65, yellow, and 0.25R as the risk unit.
The real story ran underneath the surface the entire time. Capital is quietly leaving the hot baskets of recent months and gathering where few are looking: in healthcare and cybersecurity. Of the 133 stocks our leader screen carries this week, 48 come from biotechnology. Semiconductors still defends rank 1 of the ranking, yet it is visibly losing monthly momentum, and this tension between rank and force is what will shape next week's preparation.
The plan therefore stays selective. Breadth at 37 of 100 does not carry broad breakouts, so A-grade setups with their own traction come before everything else. And Tuesday brings CPI and JPMorgan on the same morning, the date that decides what kind of week the next one becomes.
Market Map: Record, Shock, Recovery
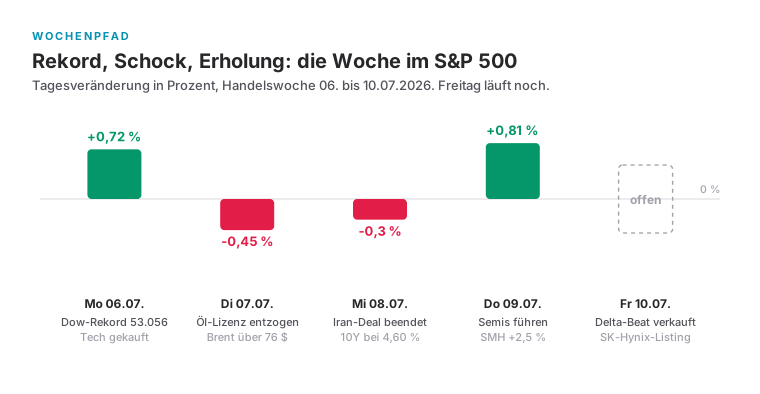
Monday belonged to the buyers. The Dow closed at an all-time high of 53,055.91, the S&P 500 gained 0.72% to 7,537.43, the Nasdaq 1.12% to 26,121.16, and technology was collected across the board. It was the last carefree day of the week.
On Tuesday Washington revoked Iran's oil sales license, Brent jumped 5% above 76 dollars, and the semiconductors slipped into distribution: MU lost 4.7%, the SMH 3%. Wednesday doubled down, the agreement was declared over, Brent rose above 78 dollars, the Dow gave up 1.1%, and the 10-year yield climbed to 4.60%, the highest since May. The regime score fell to 41. Then came Thursday, when fresh airstrikes left the market cold: the S&P 500 rose 0.81% to 7,543.64, the Nasdaq 1.30% to 26,206.89, semis led with an SMH gain of 2.5%, and oil fell. The market had digested the shock in two days. But only with narrow leadership.
Friday closed the week on a conciliatory note: S&P 500 +0.45%, Nasdaq 100 +0.38%, Dow +0.40% (measured via SPY, QQQ and DIA), while the VIX fell 6.3% to 15.84. The weekly tally reads S&P 500 +1.4%, Nasdaq 100 +1.9%, Dow -0.3%. The regime score tells the same journey in three numbers: 49 on the prior Thursday, 41 at the low, 65 at the close. Breadth improved into the weekend to 41 of 100. It remains the brake on this rally all the same.
What Changes the Plan
Anyone can read a chronicle. What matters is which events actually shift the plan for the new week, and there are three. The oil shock put rate and margin pressure back on the agenda after the market had already checked both off. Tuesday's semiconductor distribution demands tighter selection in, of all places, the strongest basket on the list. And Delta's sold-off beat shows that in this earnings season record numbers do not get paid automatically when the macro runs against them.
What Changed The Weekly Plan
Dow record close 53,056
Iran oil license revoked
US-Iran agreement ended
New US airstrikes
Delta Q2 premarket
SK Hynix listing at 149 USD
Breadth Warns Beneath the Record
A record in the Dow sounds like a healthy market, but this one was built on a narrow base. On the prior Thursday only 25.1% of stocks advanced, by Friday's close it was 30.4%, and just 52.3% of the universe trades above its 50-day line. The breadth pillar of our regime score sits at 41 of 100, and that is after a week with two recovery days.
At the same time the leadership pillar reads 76 of 100, carried by 1,232 stocks in strong momentum. That sounds like a contradiction, but it is the signature of this market phase: a narrow, strong leadership floating above a sluggish majority. For your practice it means trading breakouts only where group and stock deliver at the same time, because the majority of this market is not catching anyone right now.
The index prints records. Breadth prints work.
Stretch Check: How Extended Is QQQ Really
The worry sits on every desk: the Nasdaq is overextended after this run and needs months of digestion first. It pays to hold that worry against the data, because the data tells a more precise story. QQQ trades 15.9% above its 50-week line, and while that is the top quartile of the past five years, it is far from a record: in July 2023 the same distance reached 26%.
On the daily timeframe the stretch has long been worked off. The index sits just 1.3% above its 50-day line, 0.4% above the 21-day line, and 3.4% below a high that is now 24 sessions old. While the headlines talk records, QQQ has been consolidating sideways for over a month. The digestion everyone is waiting for is already underway.
For preparation this means the index is not the question, its leadership is. As long as the 50-day line holds, this sideways phase is base building, not topping. A daily close below it would be the first measurable deterioration, and only then does index exposure get reduced.
Mag7 Check: No Longer a Block, but Seven Separate Cases
For years the Magnificent Seven were one basket with a single button, and whoever bought the Nasdaq bought them all. This week the structure says otherwise: the group is split, and none of the seven is a market leader right now. Their RS readings range from 41 to 56 while the real leadership sits in healthcare and cybersecurity. The breadth thesis of this issue confirms itself from its most expensive side.
The individual pictures, as of Friday intraday, deserve a close look. AAPL is structurally the strongest of the group and stands, with a three-month gain of 21%, just 0.7% below its 52-week high, a pivotal point in sight. A new high on rising volume would be more than an Apple headline here, it would be a signal to the whole market. META delivered the day of the week with a 5.9% jump to 668.74 dollars, per CNBC its best week since early 2024, and the trigger is fundamental: the launch of Meta Compute as its own AI cloud business, reported capital efficiency near 22 billion dollars per gigawatt against a prior estimate of 45, and in-house Iris chip production starting in September. After that thrust the stock sits 14% above its 20-day line while still 16% below its high, a repair rally with a real catalyst.
NVDA turned 3.5% higher and back above its 50-day line, carried by Thursday's semiconductor recovery. GOOGL, AMZN and TSLA oscillate neutrally around their 50-day lines and are telling no story at the moment. MSFT, however, is the group's honest warning: 31% below the high, under the 200-day line, RS 41. Whoever buys the Mag7 basket today buys that weakness with it.
The consequence is uncomfortable but clear: Mag7 is single-stock selection again, not a bundle. AAPL above its high would be the event, META has to confirm the 20-day line as a new floor, and MSFT stays avoided until the 200-day line is reclaimed.
Rotation: Cyber, Biotech and AI Move Up
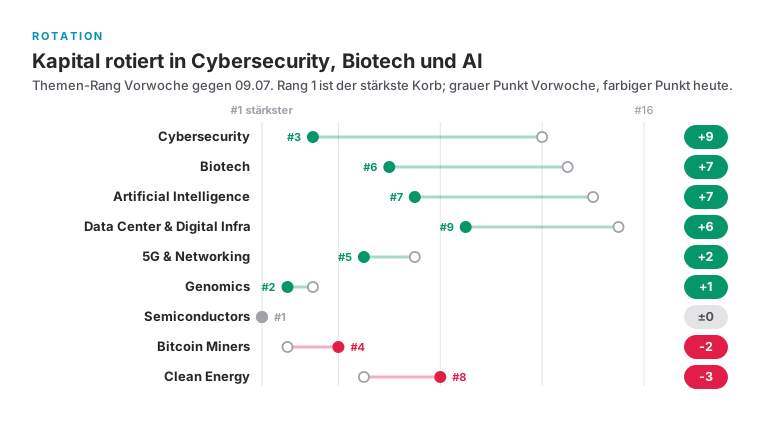
If you look at only one ranking this week, make it this one. Cybersecurity jumped from rank 12 to 3, biotech from 13 to 6, artificial intelligence from 14 to 7, and data center from 15 to 9. On the other side the market cleaned house: clean energy slipped from 5 to 8 at -15.2% on the month, and the bitcoin miners fell from 2 to 4 at -15.5%, consistent with a bitcoin that has slid to roughly 62,500 dollars.
Genomics, meanwhile, holds rank 2 with a monthly gain of 24.3%, the strongest print of any top basket. This is the point where an observation becomes a pattern: the accumulation in healthcare is not one strong day, it has been running for weeks.
Whoever wants to trade the rotation starts with the leaders of the risers: FTNT, OKTA and PANW in cybersecurity, MRNA, ARWR and BEAM in biotech, DELL, MU and ARM in the AI basket. On Friday NBIS stood out there as well, with an intraday reversal from 207 dollars to a closing gain of 2.1% at 220.66, RS 87 and a three-month gain of 54%. Honestly classified it is a repair candidate, not a screen leader, because the price sits 25% below the high and under the 20-day line. It belongs on the watch list anyway, and reclaiming the 20-day line would be the first measurable progress.
Group Strength: Stronger Baskets First
The industry ranking tells the same story with different names. Semiconductors defends rank 1, but its members lose 8.3% on average over the month, a rank living off its substance. Biotech & pharma climbs from 9 to 5 with a monthly gain of 12.4%, software works its way from 17 to 12. And at the bottom of the list, nuclear & uranium, fallen from 32 to 36, together with consumer electronics confirm the distribution in spring's story baskets. Yesterday's stories are being sold to pay for tomorrow's charts.
| Group | 1M | Rank | Avg RS | Leaders |
|---|---|---|---|---|
| Semiconductors | -8.3% | 1 (LW 1) | 81.5 | MXL, ALAB, ICHR, MU |
| Finance: Consumer Services | +11.8% | 3 (LW 4) | 93.0 | GREEL |
| Biotech & Pharma | +12.4% | 5 (LW 9) | 59.2 | OTLK, ABSI, CUE, SLS |
| Healthcare Services & Devices | +8.6% | 9 (LW 11) | 55.0 | AGL, PIII, BFLY |
| Software | +4.2% | 12 (LW 17) | 49.3 | RXT, BLZE, BAND |
| Nuclear & Uranium | decliner | 36 (LW 32) | 25.2 | distribution |
- Semiconductors
- 1M
- -8.3%
- Rank
- 1 (LW 1)
- Avg RS
- 81.5
- Finance: Consumer Services
- 1M
- +11.8%
- Rank
- 3 (LW 4)
- Avg RS
- 93.0
- Leaders
- GREEL
- Biotech & Pharma
- 1M
- +12.4%
- Rank
- 5 (LW 9)
- Avg RS
- 59.2
- Healthcare Services & Devices
- 1M
- +8.6%
- Rank
- 9 (LW 11)
- Avg RS
- 55.0
- Software
- 1M
- +4.2%
- Rank
- 12 (LW 17)
- Avg RS
- 49.3
- Nuclear & Uranium
- 1M
- decliner
- Rank
- 36 (LW 32)
- Avg RS
- 25.2
- Leaders
- distribution
Semiconductors
Rang 1 hält, Monats-Momentum bricht. Entscheidungszone: SMH gegen die 50-Tage-Linie.
Genomics
Stärkste Monatsleistung aller Spitzenkörbe, Akkumulation über Wochen.
Cybersecurity
Größter Rangsprung der Woche, von 12 auf 3. Momentum steigt mit dem Rang.
Biotech
Von Rang 13 auf 6. 48 der 133 Raster-Leader sind Biotech.
Bitcoin Miners
Von Rang 2 auf 4, Bitcoin unter 63.000 drückt den Korb.
Clean Energy
Von Rang 5 auf 8, Distribution im Story-Korb.
Dossier Semis: Rank 1 on a Crumbling Base
Semiconductors is the strongest basket on the list and at the same time its most fragile, and this week demonstrated both within two days. Tuesday brought distribution across the board, MU lost 4.7%, the SMH 3%. Thursday bought it all back, SMH +2.5%, SNDK +7.6%. Between those two days sits the question this issue asks out loud: is the basket building a top or a base?
Under the hood it looks like this: the semis theme loses 3.8% on the month and the industry averages -8.3% while the rank holds. The SMH trades 1.7% below its 21-day line and 9.5% below a high that is twelve sessions old. Relative strength without fresh momentum, that is the classic signature of a decision zone. The desk rule for it: tops are processes, bottoms are events. A top would be weeks of work, never a single red Tuesday.
The good thing about a decision zone is that it comes with marks. The top thesis wins if the SMH loses its 50-day line on a closing basis and leaders like SIMO, PENG and CRDO stop printing new highs. It is annulled the moment new highs arrive on relative volume above 1. And with SK Hynix, which debuted on Friday at 170 dollars, 14% above its offer price after raising 26.5 billion in the largest foreign IPO in US history, fresh memory capital has arrived in the basket. The debut was the first test, and the basket passed it.
How Long Do Semiconductor Bases Really Take
When the strongest basket tips into consolidation, the decisive question is not whether but how long. The SMH's own five-year history gives a surprisingly clear answer: there are two kinds of semiconductor bases, and almost nothing in between.
The routine digestions are short and grinding rather than deep: about one month in September 2021, a good three months in the summer of 2023 (3.1), a good two in the spring of 2024 (2.3), a few weeks in the autumn of 2025 and in February 2026. The cycle breaks are a different world entirely: from November 2021 to July 2023 it took 18.7 months to reach a new high, from July 2024 to July 2025 it was 11.5. Each measured from the high through a correction deeper than 8% to the next new high.
The difference between the two kinds was historically never the chart alone but always the macro behind it: in 2022 the rate cycle turned, in 2024 the question of AI capacity. Which is exactly why the current answer hangs on Tuesday. If CPI stays tame and the hike remains speculation, history argues for the short kind, one to three months of sideways work. If CPI confirms the hike debate, the 18-month path of 2022 is the honest reference. Months of consolidation are a realistic scenario, not alarmism, and the marks from the semis dossier stand unchanged.
Dossier Healthcare: 48 of 133 Leaders
The quietest story of this week is the biggest one. Our leader screen, which only passes stocks with a relative strength of at least 90, at most 15% below the high, at least +20% over three months, an ADR from 3% and at least 15 million dollars in daily volume, holds 133 names this week. 48 of them are biotechnology, joined by medical care, diagnostics and healthcare insurers. No other block fields even half of that.
Genomics leads the monthly theme list at +24.3%, biotech follows at +15.1%. And the quality of this move reaches into the tight ranges: RVMD stands at RS 99 just 2.3% below its high, CRNX practically at the high, joined by HUM and CNC from the insurers and ILMN in diagnostics. This is not a sector panic to the upside, this is accumulation over weeks.
For the new week healthcare therefore goes on the first watch list, focused on bases near highs rather than on the names that have already run. The best entries appear where the accumulation is still quiet.
Dossier Cybersecurity: From the Edge to the Top
The biggest rank jump of the week came from where nobody had it on their sheet: cybersecurity, from rank 12 to 3. The basket combines what has become rare in this regime, defensive demand and growth charts near their highs. FTNT stands at RS 94 just 4.1% below its high with a moderate 4.2% ADR, OKTA at RS 94 in exactly the same zone, and PANW and RPD follow inside the basket.
The geopolitical week delivered the catalyst for free, because escalation raises security budgets no matter where the rate cycle stands. And unlike the semis, momentum here rises with the rank: +11.0% on the month.
The work order that follows: run FTNT and OKTA as pivotal point candidates, take entries only at tight marks, and do not buy into the weekly candle that has already run.
Earnings: Delta's Beat Without Reward
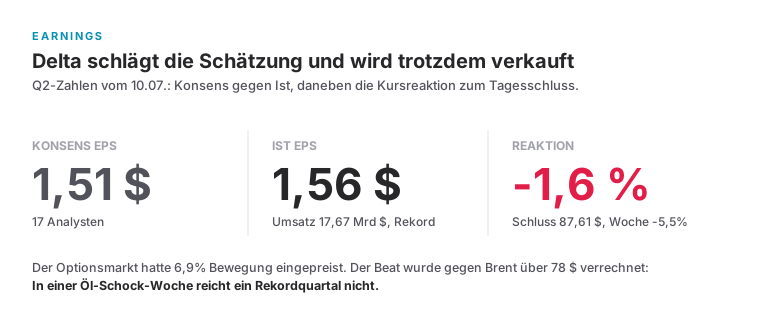
DAL delivered everything on Friday morning that you can ask of a quarter: EPS of 1.56 dollars against an expected 1.51, record revenue of 17.67 billion, 14% above last year, and a reinstated full-year guidance of 6.50 to 7.50 dollars. The market read it and sold anyway. The stock closed at 87.61 dollars, 1.6% below the prior day and 5.5% below where it stood a week ago.
That reaction belongs in the playbook for the entire season. In a week with Brent above 78 dollars, an airline record gets netted against the fuel bill, and a beat is not enough when the macro thread runs against it. Just as remarkable, though, is what did not happen: the options market had priced in a 6.9% move, and the reaction stayed far below it. Disappointment yes, panic no.
The broad season opens on Tuesday, when JPMorgan reports at 7:00 ET and the June CPI lands at 8:30 ET. How the market processes bank numbers and inflation data on the same morning will define the regime of the coming weeks. The follow-up check sits in issue 005.
Tight Ranges Near Highs
This is the week's control list: names from the leader screen standing at most 5% below their high, with an ADR moderate enough for clean risk control. What stands out about this list is its color, because cybersecurity and healthcare field almost every name. Tight ranges near highs are the raw form of the pivotal point. The next generation of breakouts is built here, and whoever has them on the sheet early does not have to chase them later.
| Symbol | RS | ADR | Group | To High | Avg $Vol |
|---|---|---|---|---|---|
| FTNT | 94 | 4.2% | Cybersecurity | -4.1% | 1,013M |
| HUM | 94 | 3.6% | Healthcare Plans | -3.3% | 653M |
| RVMD | 99 | 4.2% | Biotechnology | -2.3% | 589M |
| OKTA | 94 | 5.3% | Cybersecurity | -4.0% | 568M |
| CNC | 94 | 3.6% | Healthcare Plans | -2.4% | 409M |
| ILMN | 91 | 3.9% | Diagnostics | -4.6% | 362M |
| CRNX | 98 | 4.5% | Biotechnology | -0.2% | 258M |
| BTSG | 96 | 3.2% | Healthcare Services | -2.3% | 245M |
- RS
- 94
- ADR
- 4.2%
- Group
- Cybersecurity
- To High
- -4.1%
- Avg $Vol
- 1,013M
- RS
- 94
- ADR
- 3.6%
- Group
- Healthcare Plans
- To High
- -3.3%
- Avg $Vol
- 653M
- RS
- 99
- ADR
- 4.2%
- Group
- Biotechnology
- To High
- -2.3%
- Avg $Vol
- 589M
- RS
- 94
- ADR
- 5.3%
- Group
- Cybersecurity
- To High
- -4.0%
- Avg $Vol
- 568M
- RS
- 94
- ADR
- 3.6%
- Group
- Healthcare Plans
- To High
- -2.4%
- Avg $Vol
- 409M
- RS
- 91
- ADR
- 3.9%
- Group
- Diagnostics
- To High
- -4.6%
- Avg $Vol
- 362M
- RS
- 98
- ADR
- 4.5%
- Group
- Biotechnology
- To High
- -0.2%
- Avg $Vol
- 258M
- RS
- 96
- ADR
- 3.2%
- Group
- Healthcare Services
- To High
- -2.3%
- Avg $Vol
- 245M
Study Candidates
Three candidates from the screen, one for each story of this week: AI hardware at the high, healthcare accumulation, the semis decision zone. All three are study objects with marks, not recommendations, and the full chart sits behind every ticker.
Hardware, Equipment & Parts. AI-Hardware am Hoch. RS 99
RS 99 am 52-Wochen-Hoch mit 280M Dollar-Volumen. Erste enge Flagge über der 21-Tage-Linie abwarten; darunter ist die These ungültig.
Biotechnology. Healthcare-Akkumulation. RS 98
Ruhigste ADR im Biotech-Korb, praktisch am Hoch. Konsolidierung über der 21-Tage-Linie als neue Basis werten.
Semiconductors. Semis-Entscheidungszone. RS 99
Pullback in Stage-2-Struktur, Memory-Umfeld stützt. Schluss unter der 50-Tage-Linie beendet die Studie.
Profile: Penguin Solutions
PENG is this issue's high-pressure candidate. The stock closed at its high, the 52-week high dates from the last session, with RS 99, a three-month gain of 259%, an ADR of 12.4% and 280 million dollars in daily volume. The price stands 45.7% above the 50-day line and 22.7% above the 21-day line.
Those numbers say two things at once. The demand is real and institutional, because no stock carries this kind of volume to its high otherwise. And the distance to every support line is so wide that the clean entry simply does not exist here. The stock's own history has seen bigger stretches, up to 107% above the 50-day line, but history is not a setup. The study order is therefore to wait for the first tight flag above the 21-day line. If the price closes below it, the strength thesis is void.
Profile: Crinetics Pharmaceuticals
CRNX carries the healthcare thesis with the calmest structure in the entire basket. RS 98, a close practically at the 52-week high, which is only two days old, a three-month gain of 109%, and all of that with a moderate 4.5% ADR and 258 million dollars in volume.
The stretch here is the counterpoint to PENG: 111% above the 50-day line after a trend thrust, the third highest reading of its own five-year history. This is no longer a fresh breakout, but it is very much intact accumulation. The study order: treat a consolidation above the 21-day line as a new base. If the price falls back below last week's breakout level, the thesis is broken.
Profile: Silicon Motion
SIMO is the semis question in portfolio format. RS 99, three months +162%, an ADR of 8.3%, 366 million dollars in volume, and currently 8.7% below a twelve-day-old high, 17% above the 50-day line, 6.5% above the 21-day line.
The stock traces the basket question in miniature: is this a pullback inside an intact stage-2 structure, or the first building block of a top? The memory backdrop, with the strong SK Hynix debut and Thursday's MU recovery, argues for the first read. The study order: if the 21-day line holds and volume turns to the buy side, the pullback is the opportunity. A close below the 50-day line ends the study.
SpaceX Below the Mark: The IPO Base Is Broken
SPCX has been listed since June 12 and was the biggest IPO of the year, until SK Hynix took that title this week. The debut close was 160.95 dollars, the peak three days later 225.64, a 40% premium on the first close. Since then the price has been working its way lower, and trading volume has visibly ebbed.
Friday put this story in writing. SPCX closed the week at 147.48 dollars, 9% lower than seven days before and below the 150 mark for the first time. The first IPO base has resolved to the downside, not the upside, and that is no longer a scenario but the standing state. A fresh IPO below its debut price and below the psychological mark is not a long setup, however big the story behind it. Story and structure are two different tests, and SPCX currently passes only one.
For the watch list this means: below the IPO low of 145.20 the range is open to the downside and the name stays untouchable. Only a reclaim of the zone between 150 and the debut close at 161 would repair the base and start a new study. Until then SpaceX is a dated observation.
Rejected Candidates
Three candidates reached the screen and were cut anyway, and their reasons are part of the process, not footnotes. Not every strong chart is close enough to a pivotal point, and saying so out loud is part of the work.
| Symbol | Lesson | Reason |
|---|---|---|
| AZUL | Momentum without structure is not a setup. | RS 99, but +422% in three months is overextension without a base. An airline in Delta week adds event risk. |
| CUE | Position sizing starts with the chart, not the account. | A 14.7% ADR breaks risk control at 0.25R, 22M dollar volume sits at the screen's floor. |
| SLS | Not every strong chart is close enough to a mark. | 13% below the high at a 12.2% ADR. The pullback is too deep and too volatile for pivotal point proximity. |
- Lesson
- Momentum without structure is not a setup.
- Reason
- RS 99, but +422% in three months is overextension without a base. An airline in Delta week adds event risk.
- Lesson
- Position sizing starts with the chart, not the account.
- Reason
- A 14.7% ADR breaks risk control at 0.25R, 22M dollar volume sits at the screen's floor.
- Lesson
- Not every strong chart is close enough to a mark.
- Reason
- 13% below the high at a 12.2% ADR. The pullback is too deep and too volatile for pivotal point proximity.
+422% in drei Monaten ist Überdehnung ohne Basis, Airline in der Delta-Woche trägt Ereignisrisiko.
Momentum ohne Struktur ist kein Setup.
ADR 14,7% reißt die Risikokontrolle bei 0,25R, Dollar-Volumen 22M an der Untergrenze des Rasters.
Positionsgröße beginnt beim Chart.
13% unter dem Hoch bei ADR 12,2%, zu tief und zu volatil für Pivotal-Point-Nähe.
Nicht jeder starke Chart ist nahe genug an einer Marke.
Macro Frame: Oil Reaches Into Single-Stock Reactions
This week's frame fits into four numbers, and each of them has consequences. Brent rose above 78 dollars after two escalation steps. The 10-year yield ran up to 4.60% and came back only hesitantly to 4.56%. The dollar index held at 101 with a weekly gain, and gold traded above 4,100 dollars. Behind it all sits the real break: the market now prices roughly a 70% probability of a September rate hike, and with that, spring's easing fantasy is officially buried.
Bitcoin slid to 62,200 to 62,900 dollars and delivered the explanation for the miners' distribution along the way. The VIX oscillated between 17 and 18 and relaxed into the weekly close at 15.84, elevated but without a panic spike.
For your process this means rate and oil sensitive setups carry an extra burden of proof until CPI and the Fed meeting on July 29 have clarified the picture.
Working Rule: 0.25R and the Follow-Up Check
The regime dictates the size, not the conviction. At yellow with warning breadth the risk unit stays at 0.25R, and new positions need group, stock and mark at the same time. Two out of three is not enough, however tempting the chart looks.
The second rule of this issue is about honesty with yourself: every open expectation gets its follow-up check. Delta's closing price, the SK Hynix debut, Friday's index closes, everything this issue expected will stand next to its actual value in the next one. Forecasts that are never checked teach nothing.
Outlook: July 14 Decides
Tuesday is the densest date of the new week, and it arrives as a double feature: JPMorgan opens the earnings season at 7:00 ET, and the June CPI follows at 8:30 ET. A hot inflation print into an already live rate-hike debate would be the stress test for the 4.60% mark on the 10-year yield and for everything priced off multiples.
The week's control points in order: first the SMH against its 50-day line, because that is where the semis decision falls. Then the healthcare control list with RVMD, CRNX, HUM, CNC and ILMN for base breakouts. Third, FTNT and OKTA at their marks. And above it all the regime score: above 60 with better breadth opens the book, below 50 closes it again.
What this issue leaves open will stand next to its actual value next time. That is how we work.